How a renewable energy software solution can help energy companies connect with their customers
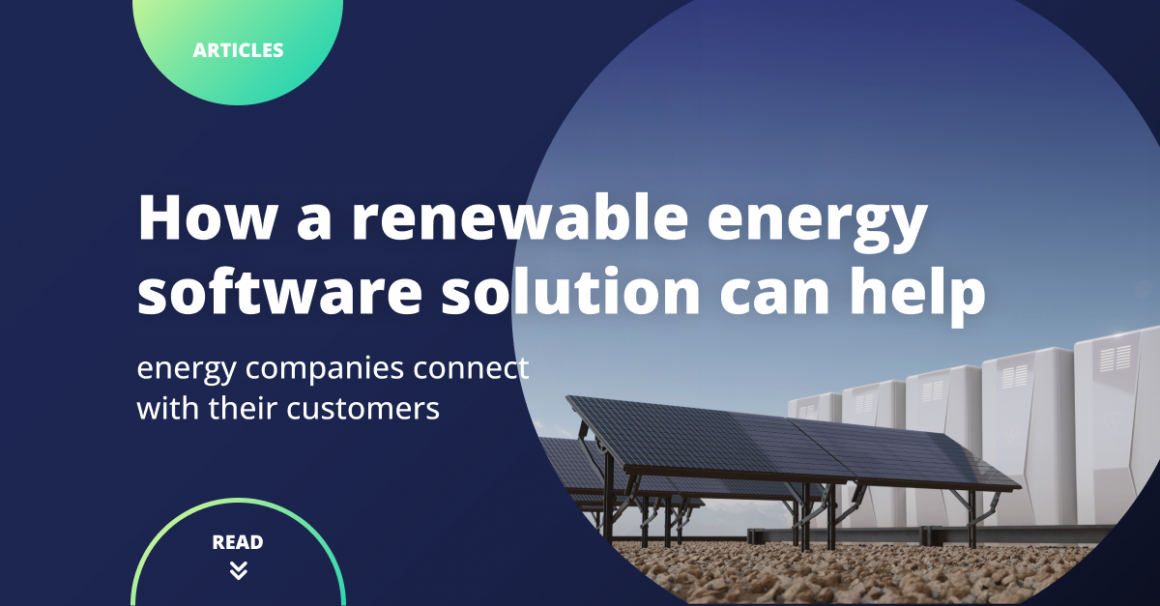
Despite its many benefits, renewable energy has one major drawback – it’s unpredictable. During sunny or windy days, plants can generate far more power than is needed at the moment. As soon as the wind stops or the sun gets covered by clouds though, the energy production stops as well.
That makes it essential for both renewable energy companies and their customers to track their energy generation and consumption in real time and respond to the changes in how solar panels or wind turbines work. And for this, you and your customers need plenty of data. How can you gather and share the data with your customers, though?
Renewable energy software does have a few features that can be very useful for this task. Namely, real-time asset monitoring, analytics tools with data visualization, and a custom portal for your users. How can those features help keep your staff, stakeholders, and users on the same page?
What are the main problems with managing renewable energy resources?
A major benefit of fossil fuels is that their energy output is predictable. We can estimate how much fuel we need to cover our needs and then use it to keep the power flowing without any disruptions. For energy companies, the predictability of fossil fuels also allows them to keep the grid in balance.
Renewable sources are anything but predictable though – everything depends on the current weather conditions.
Two examples from the UK:
- On 30th December 2022, wind turbines managed to cover 87.2% of the entire energy production in the United Kingdom that day, thanks to very windy weather that day.
- From May to August, European Union saved $29 billion on fossil gas imports, thanks to record amounts of solar energy generated.
On the one hand, this shows that we technically could entirely replace fossil fuels with just clean energy – especially if we connect renewable plants with storage technologies.

For our current electrical infrastructure, renewable energy is too unstable to handle though. As the amount of power generated can change in a matter of minutes, that either forces the grid to take the surplus energy or to quickly cover for the drop in renewable energy production. And that unfortunately might lead to short circuits and power cuts.
But there’s one more reason why renewable energy plants are harder to manage – namely, they need space. Solar panels for homes or small businesses can be mounted on the roofs, so they don’t need any additional space. If a company needs far more power than those small panels can generate though, then they need to find a suitably large place for the ground-mounted solar panels.
The general rule of thumb is that for every 1kW of solar panels needed, the area required is approximately 100 square feet/9 Square Meters. So for a 1mW solar PV power plant, for example, the area required would be about 2.5 acres. Wind farms themselves need even more space – a 2 MW wind turbine might need, on average, 80 acres.
That means that very often, the wind or solar farms are settled far away from where the company owning those plants is located, or they are operating from a few separate locations. So how can the owners then monitor the performance of the renewable plants and share the information with their clients or stakeholders?
Custom-made software for renewable energy management might be the answer here.
Why should energy companies focus on improving communication?
With solar or wind power generation being so unpredictable, it’s vital that both renewable energy industry companies but also their clients learn how to manage the power efficiently. And for this, regular communication between the utility company, its stakeholders, and clients is essential.
By sharing information about the system performance or any issues that might affect clients, businesses can build trust between them and clients and better meet their needs. Simply – the more information customers have about how much energy they consume and where, the easier it is for them to adjust the electrical system to their needs.
Having the energy data in a format they can easily understand (such as charts or graphs visualizations) can also tremendously help them in figuring out how they can reduce their consumption and save on their bills. For example, based on the data inside the web and mobile applications, they could predict when the grid energy would be the cheapest and schedule the most energy-intensive tasks for that time. Meanwhile, during peak usage, they could set their devices to use their solar installations or storage systems.
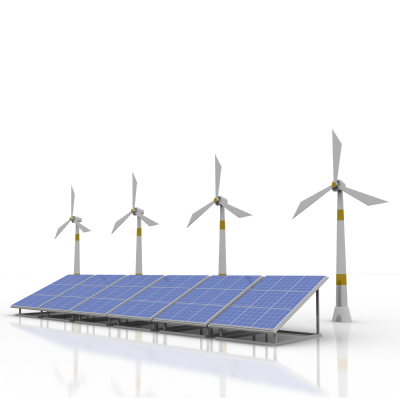
By doing so, consumers could become more engaged, confident, and, in some ways, also more self-reliant.
However, with the data spread around dozens of renewable plants, equipment and very often in separate locations, managing and analyzing the data for insights is a very time-consuming task. Managing renewable plants with different applications can make it even more challenging to make sense of the data. Making the data reliable, visual and keeping it updated is another big challenge.
Fortunately, you don’t have to gather, analyze or update the plant and equipment data and then share it with the customers manually anymore. Instead, you can leave such tasks to dedicated management systems for renewable energy.
4 ways in which renewable energy software can boost communication between the company, stakeholders, and customers
We’ve talked a bit about the main benefits of using custom-made software for a renewable energy company in one of our previous articles. However, there’s one point we decided needs a separate article rather than just a short mention.
Namely, how much easier those solutions make sharing the data between everyone connected to your business.
Below, we mentioned three features that can be especially useful for enhancing communication between your employees, stakeholders, and users – here are they.
Analytics suite connecting all of your renewable plants and equipment together
Today’s analytical tools can give far more data on how your entire infrastructure is performing than ever before. What’s more, as they keep gathering the data 24/7, they can also update the data in real time, so you always have access to both historical and the latest metrics.
If each device you are using comes with its own analytical solution or your business departments all use a different platform for monitoring the performance, then comparing the data for insights and reporting might quickly turn into a headache.
What if the data from your renewable plants and equipment were gathered, stored, and organized inside one platform? Wouldn’t that make analyzing the data and then sharing the information with other teams, company branches, and stakeholders much easier? Definitely, as everyone would have access to the same data, rather than have six separate data reports.
In that way, collaborating with different company branches, preparing accurate reports for stakeholders, and scheduling maintenance checks would become much smoother as well.

Data visualization for stakeholders’ meetings
Having plenty of data related to your renewable plants’ operation gathered is one thing. For the data to be valuable though, you need to compare the data together to look for key insights and patterns.
Let’s say that you want to compare the performance of your five wind farms that are located in different places and then show the data to the stakeholders. Technically, you could just add the data to a regular Excel spreadsheet or make it into a report and then send it to the stakeholders. You would have to spend a lot of time creating the data sheets or reports though. What’s more, the stakeholders would also need some time to read through the sheet rows and gather critical information from it.
Using custom software’s data visualization features could make turning complex data into valuable insights much easier, as you would need just a few clicks to generate charts and graphs from the data. Besides that, you can also customize the graphs or charts in a way that fits your company’s needs the most. For example, you can set that the charts should be made only of data coming from last week or from only two specific plant locations, and the software will handle the rest.
As a result, you won’t have to spend hours creating spreadsheets, and the stakeholders will have all key information visible to them straight away, without having to go through several report pages.
Data visualization for customers
As we mentioned earlier in the article, visualized data is also much more useful for customers as they need far less effort to compare and understand the data. Think about it, how many times have you heard other people complaining that the regular energy bills are confusing and difficult to read?
Bills are essentially just rows of data that customers have to compare, pick the essential information from it and then analyze the results. That takes plenty of time and can be confusing, especially for people who don’t understand energy terminology.
Data visualizations can make it much easier for them to understand their bills and consumption. One look at the charts, and they can quickly see what is their current energy consumption, what devices use the most energy, and even what is the state of their batteries if they use those. That gives them far more insight into how they are using the grid and renewable energy, how much they will have to pay for the next bill, and what they could do to lower their consumption.
Customer portals
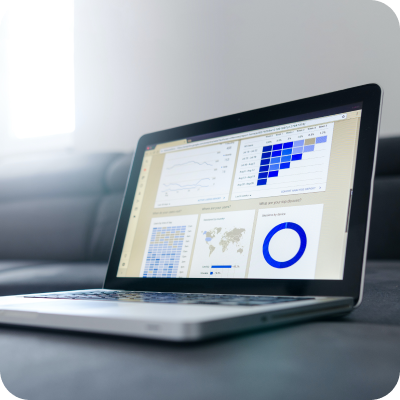
The data has been gathered and turned into visuals, but how do you ensure that your customers can access them whenever they want? Having a dedicated portal for your customers is one of the best ways to keep them informed and engaged. In fact, 88% of customers expect companies to have an online self-service portal through which they can handle some simple tasks or find an answer to their issues themselves, without having to reach out to support.
And for utility companies, giving their customers access to such a portal is an especially smart idea as it allows them to monitor their usage and costs at any time. Even better is that you can take the usage data you have to craft personalized energy-saving tips or unique pricing plans and then show them directly inside the portal.
By sharing accurate and personalized information that your customers can access and use straight away, they see you as someone they can rely on.
Communication in renewable energy: what’s next?
There’s one more technology on the horizon that might soon completely transform the energy industry – smart grids.
Currently, how much renewable energy we can generate has to be limited to avoid overwhelming the grid. National Grid had to spend £215m last year to turn off some of the UK’s wind turbines during windy days, as the traditional grid couldn’t handle the amount of energy flowing through it.
Smart grid solutions could be an answer to this problem. Thanks to dozens of integrated sensors and monitoring modules, smart grids can collect real-time information on the current condition of the grid and then share the gathered information with utility companies and end-users. Moreover, smart grids will also be able to automatically balance the load to prevent infrastructure overload. This way, integrating renewable energy plants with the grids would also become far smoother.
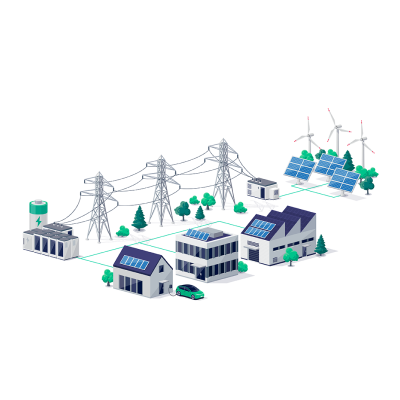
Smart grids could also make communicating with customers much more efficient, as they will be able to send data from the renewable energy sector to customers and vice versa virtually immediately. For example, let’s say that the system notices that one of the household devices connected to the grid is malfunctioning. The smart grids can then automatically cut off the electricity to the device and then send an alert to the user and to the utility company about the issue.
It will still take long years before smart grids will replace our current electrical infrastructure though, as it is far more complex and costly to design than our existing grids. So for boosting the efficiency of solar or wind farms, going with renewable energy software development is currently still the best option.
Conclusion
Data generated by the renewable plants and equipment is invaluable both for you and your staff but for your end-users as well. The more data you have on how your renewable plants and storage systems work, the easier it will be for you to optimize them for the best performance. Meanwhile, customers can use the collected data to learn more about their energy consumption and how they could reduce it.
For this though, just sending them a monthly report with rows of data is no longer enough. The data has to be available for them whenever they need it, be regularly updated, and be shown in a format customers can understand easily. Custom-made renewable energy software solution though can help you handle all those tasks with ease – while also boosting the efficiency of your entire infrastructure. Reach out to our development team at Codibly, and we’ll show just how much more productive your company can be with a custom renewable energy software.
contact us
Need expert guidance on your next energy project?
Reach out to us and discover how Codibly can offer tailored solutions to drive your business.