Demand Response in PJM: Aggregator Software Implementation Guide for Emergency Load Response & Capacity Performance

A search for “demand response in PJM” returns a SERP that is half PJM authority PDFs and half aggregator service pages. None of them tell you what software an aggregator or utility actually needs to participate profitably. The price PJM is paying for capacity is now meaningful: the 2025/2026 Delivery Year (in effect through May 31, 2026) cleared at $269.92 per MW-day for the RTO, with the BGE and Dominion zones hitting their zonal caps at $466.35 and $444.26 respectively; the 2026/2027 Delivery Year, starting June 1, 2026, cleared at the $329.17 system-wide cap (~$120,000 per MW-year) with all previously-constrained zones pulling down to that cap, up roughly 11× from the 2024/2025 Delivery Year’s $29 per MW-day. At those prices, the participation-versus-software gap is a real margin question.
PJM operates four interlocking demand response and demand-side mechanisms an aggregator or utility can bid into: Emergency Load Response Program (ELRP) for emergency events, Capacity Performance for the year-round capacity market, Synchronized Reserve Market (SRM) for sub-second response, and Economic Demand Response for energy-market arbitrage. Each demands different software: different latency tolerances, different telemetry resolution, and different settlement rules. This guide walks through what an aggregator software stack actually has to do to bid these programs at scale — and where the build-versus-buy line falls.
For broader DR aggregator economics, our demand response aggregator business models breakdown covers the FERC 2222 architecture; this article is the PJM-specific implementation companion.
PJM Demand Response Is Four Programs, Not One — and Each Demands Different Software
The first mistake aggregators and new utility entrants make is treating “PJM demand response” as a single category. It is not. PJM runs four mechanisms that look adjacent at the program-marketing level but separate sharply once a software team starts building against them.
Emergency Load Response Program (ELRP) is the event-driven curtailment program — when the grid is under stress, PJM dispatches enrolled load to reduce consumption for a typical two-to-four hour window, with notification windows of thirty minutes to two hours and capacity plus energy payments for delivered curtailment. Capacity Performance is the year-round commitment market — bid into the Base Residual Auction or Incremental Auctions for the relevant Delivery Year, then maintain availability against Performance Assessment Hours (PAH) which can occur during summer and winter peak hours, with sharp penalties for underperformance. Synchronized Reserve Market (SRM) requires sub-second-latency reserve capacity that can be dispatched within ten minutes for typical durations of thirty minutes or less, ten to twenty events per year, with continuous availability obligations. Economic Demand Response, finally, is the energy-market arbitrage option — voluntary, price-driven curtailment when the locational marginal price (LMP) exceeds a threshold; settlement is energy-only.
Aggregators conflate the four at sales-pitch level because the buyer story sounds the same: “we get you paid for using less power.” At the implementation level the conflation is expensive. ELRP and Capacity Performance share an asset registry but want different telemetry resolutions; SRM and Capacity Performance share continuous obligation but operate on different time scales; Economic DR and ELRP share dispatch infrastructure but settle differently. A platform built for one without anticipating the others either ships with rebuilds in the near future or caps the aggregator at a single-program portfolio.
The PJM-as-platform mental model
It helps to think of PJM not as one demand response program but as a marketplace stack: a capacity market underneath a year-ahead procurement layer, an energy market clearing every five minutes on top of that, and ancillary services markets layered for sub-second balancing. Demand response sits across all three layers, with different rules at each one. An aggregator software stack that does not separate these layers in code will fail to optimize across them in operation.
Why “PJM-compatible DR software” is a misleading shorthand
Vendors selling “PJM-compatible DR software” often mean they handle ELRP and a subset of Economic DR. That is half the market. A platform that cannot also handle Capacity Performance Assessment Hour compliance, or that cannot bid SRM with sub-second telemetry, leaves the highest-value programs on the table. Treat “PJM-compatible” as a starting question, not an answer.
Who Actually Participates: Curtailment Service Providers, Utilities, and the End Customer
PJM does not contract directly with most demand-side resources. The market is intermediated by registered Curtailment Service Providers (CSPs) — entities like Voltus, CPower, Enel North America, and Enel X are CSPs in the broader sense; some operate primarily in the C&I aggregation lane while others serve utility-procurement programs. Behind the CSPs sit utilities — PSEG, Dominion, BGE, Pepco, FirstEnergy operating utilities, AEP, Duquesne — running their own internal demand response programs that may or may not bid into PJM directly. End customers are the C&I sites, data centers, and increasingly EV-charging fleets that provide the actual curtailable load.
Software roles differ at each layer. A CSP’s platform needs to handle multi-utility customer enrollment, settlement reconciliation across hundreds of sites, and PJM bid management. A utility-internal platform needs to handle customer enrollment, dispatch coordination with other distribution operations (outage management, distribution operations), and rate-tariff integration. An end customer’s facility-level controls need to receive dispatch signals from one or more programs without disrupting production. A platform built for one role rarely fits another without significant rework.
What changed with the 2024–2026 capacity-price spike
The PJM 2025/2026 Base Residual Auction cleared at $269.92 per MW-day for the RTO, up nearly 9× from the prior Delivery Year’s $29, with the BGE and Dominion zones hitting their zonal caps at $466.35 and $444.26 respectively. The 2026/2027 BRA, held in July 2025, then cleared at the $329.17 system-wide cap, a 22% RTO-wide increase that pulled previously-constrained zones down to the cap (BGE and Dominion both fell from their prior caps to $329.17). The combined market value crossed $16.1 billion in 2026/2027, up from $14.7 billion in 2025/2026. The price signal pulled new participants into demand response across the PJM footprint — most visibly, large data center operators began enrolling backup generation and curtailable load to participate. The platforms that scaled best in this environment were the ones that could onboard a single high-MW participant (a hyperscale data center) with the same dispatch and settlement logic they used for a portfolio of small C&I sites. The ones that struggled were architected around small-site portfolios and could not handle single-asset bids cleanly.
Emergency Load Response Program (ELRP): Software for Event-Driven Curtailment
ELRP is the PJM program most aggregators start with — the cleanest dispatch mechanic, the most predictable software requirements. PJM dispatches ELRP when the grid faces actual or imminent capacity shortage; events are typically two to four hours, with thirty-minute to two-hour notification windows depending on event type. Participants earn capacity payments for committed availability plus energy payments for delivered curtailment during events.
What the software has to do for ELRP is operationally tight: ingest the dispatch signal from PJM (typically through PJM’s DR Hub API or an OpenADR fallback), validate enrolled-asset eligibility against the registry (no asset already committed to another program at the same hour), disaggregate the curtailment target across enrolled sites, push control commands within the notification window (OCPP for EV chargers, OpenADR or IEEE 2030.5 for DERs, Modbus for industrial HVAC), capture sub-minute telemetry through the event window, and run the Customer Baseline Load (CBL) calculation that determines settled volume. PAH-style compliance scoring evaluates each event independently — there is no rolling average, so a single missed event affects that event’s settlement directly.
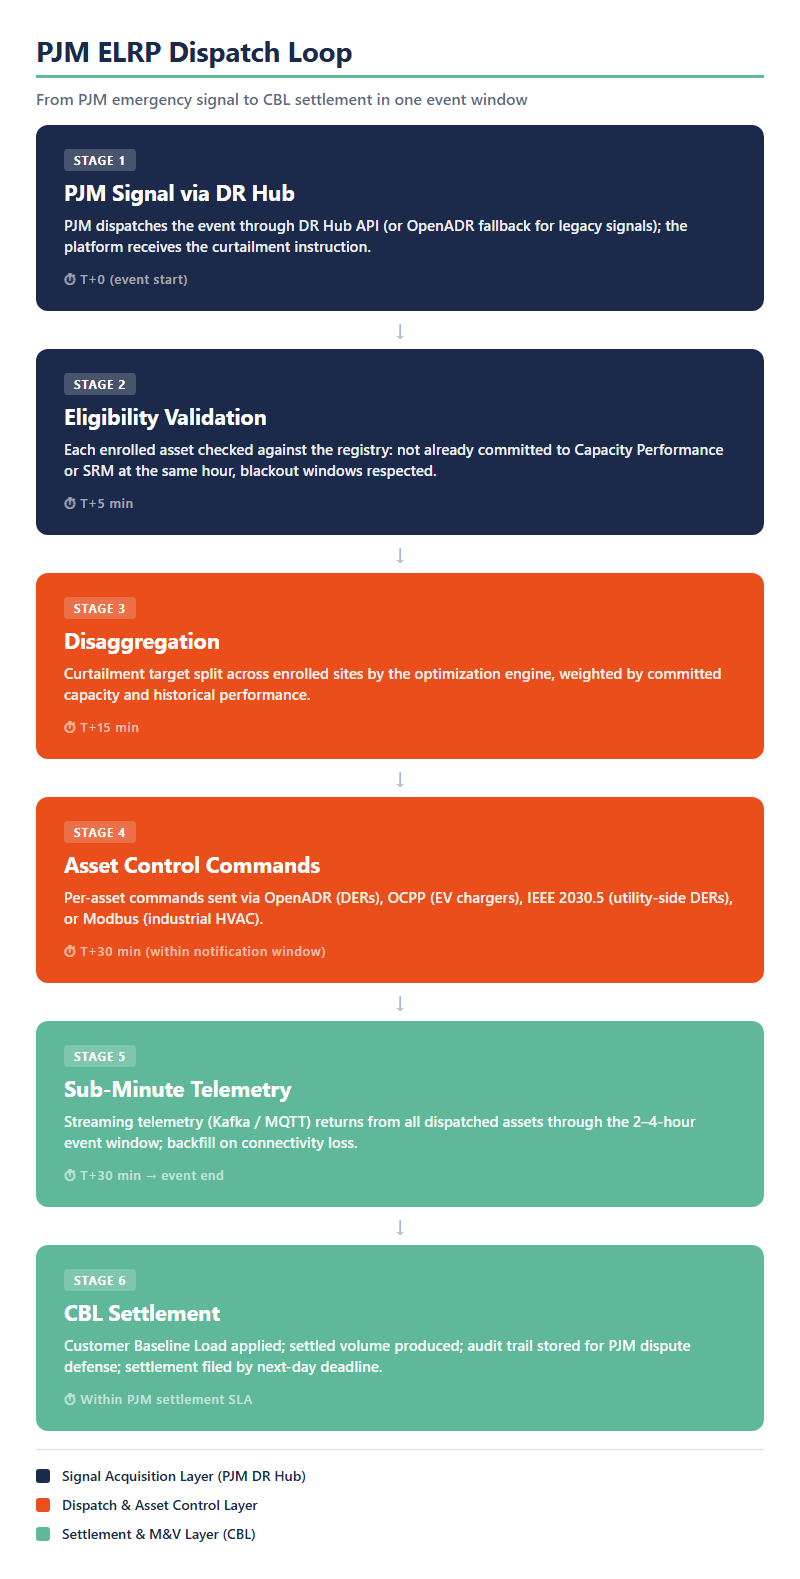
The ELRP dispatch loop in 60 minutes
The compressed version: at T+0 the dispatch signal arrives. By T+5 minutes the platform has validated eligibility and started disaggregation. By T+15 minutes per-asset commands are sent. From T+30 minutes through event end (T+2 to T+4 hours typically), telemetry streams in. After event close, the CBL calculation runs and produces settled volume by the next-day deadline. A platform that takes thirty minutes to validate and disaggregate misses the notification window for fast-dispatch ELRP variants, which means the curtailment is not credited.
Why baseline calculation is half the engineering effort
CBL, weather-normalized regression, or synthetic-comparable: PJM accepts methodologies that meet specific reliability and audit-trail requirements. Get the baseline wrong and either the settled volume is wrong (revenue leak) or PJM disputes the settlement (penalty risk plus dispute-workflow overhead). Aggregators routinely outgrow vendor SaaS specifically because the baseline methodology the vendor ships does not fit the aggregator’s portfolio mix. For broader automated-DR architecture, our automated demand response programs walkthrough covers the dispatch-pattern fundamentals.
Capacity Performance: Software for Year-Round Continuous Performance Obligation
Capacity Performance is where the software requirements get harder — and where most platforms underdeliver. Capacity Performance is not a discrete-event program. It is a year-round commitment to deliver capacity during Performance Assessment Hours (PAH), which PJM calls during summer peak, winter peak, and other emergency conditions. Underperformance during PAH triggers Non-Performance Charges that can offset or exceed the auction premium for that Delivery Year.
What the software has to do for Capacity Performance: maintain thirty-day rolling availability monitoring against the committed capacity, run weather-correlated peak forecasting to anticipate PAH-eligible hours, model asset-level outage risk and reserve fallback capacity, run the Capacity Performance settlement that nets capacity payments against Non-Performance Charges, and surface the combined revenue forecast for the procurement team that bid the auction. The phrase pjm capacity performance software describes a category of tooling that did not exist in 2018; it is now a buyer requirement for any aggregator or utility participating at scale.
The depth of the Capacity Performance penalty mechanic is what separates serious software from marketing copy. A platform that does not model Non-Performance Charges as a forward liability is, in practice, undercapturing the cost of bidding capacity it cannot guarantee. The platforms that handle Capacity Performance well treat the bid auction as a portfolio optimization problem: how much capacity can we commit such that the expected revenue minus expected NPC exceeds the alternative use of that capacity in another program. That is an integer-programming problem, not a spreadsheet.
| Software dimension | Emergency Load Response (ELRP) | Capacity Performance | Synchronized Reserve Market (SRM) |
|---|---|---|---|
| Notification window | 30 minutes – 2 hours depending on event type | Continuous availability — Performance Assessment Hours called during peak windows | Sub-second — must be deployable within 10 minutes |
| Dispatch latency | Minute-scale — control commands within notification window | Sustained — capacity available throughout PAH-eligible hours | Sub-second — automated response, telemetry-confirmed |
| Telemetry resolution | Sub-minute through event window | Hourly for PAH compliance scoring | Sub-second for real-time response verification |
| Payment structure | Capacity availability + per-event energy for delivered curtailment | Capacity auction clearing price minus Non-Performance Charges for under-delivery | Capacity + Reserve real-time market payments |
| Settlement methodology | Customer Baseline Load (CBL) or weather-normalized regression | Hourly UCAP performance against committed capacity | Sub-five-minute real-time market settlement |
| Software subsystem most stressed | Dispatch Engine + M&V — fast disaggregation and CBL accuracy | Optimization Engine + NPC liability modeling — forward portfolio risk | Telemetry Backbone + Signal Acquisition — sub-second latency end-to-end |
The Capacity Performance auction structure
PJM procures capacity through a Base Residual Auction (BRA) held three years ahead of the Delivery Year, plus three Incremental Auctions held annually leading up to the Delivery Year. Aggregators bid demand-side resources alongside generation; cleared resources commit to deliver during PAH. Software has to support both the auction-bidding workflow (offer construction, capacity declaration, certified availability) and the year-round delivery against the cleared commitment. The bid platform and the operations platform are usually built by different teams and frequently fight each other when they share state.
What “performing” means under the PAH framework
PAH compliance is measured against the cleared Unforced Capacity (UCAP) commitment for each resource. A resource that delivers above UCAP during PAH earns Performance Bonus payments; one that delivers below pays Non-Performance Charges. Both calculations run at the resource level, hourly, during PAH-eligible hours. The software pipeline that ingests PAH notifications, captures hourly telemetry, computes performance, and settles is the most-stressed part of the platform during Capacity Performance Delivery Years. Build it accordingly, or buy from a vendor whose Capacity Performance settlement engine is provably battle-tested.
The Aggregator Software Stack for PJM Markets: Five Subsystems
A platform that bids ELRP, Capacity Performance, SRM, and Economic DR concurrently has five subsystems that have to scale and fail independently. Treat the stack as a monolith and the failure mode of one program (an ELRP dispute, an SRM telemetry gap, a Capacity Performance NPC hit) cascades to the others. Treat it as five subsystems with clear contracts and the platform isolates failures, scales the bottleneck without rebuilding the rest, and supports portfolio optimization across programs.
The first subsystem is Signal Acquisition — PJM DR Hub API endpoints, OpenADR fallback for legacy ELRP signaling, and any direct utility integrations for utility-internal programs. The second is Asset Registry and Telemetry — Kafka or MQTT streaming, sub-minute resolution for ELRP and Economic DR, sub-second for SRM, with backfill behavior when device connectivity drops. The third is Dispatch and Optimization — the multi-program portfolio engine that decides which sites curtail for ELRP versus Capacity Performance versus SRM at any moment, given protocol latency, contract penalties, and forecast performance; this is where Capacity Performance NPC liability gets modeled forward. The fourth is M&V and Settlement — CBL or weather-normalized regression for ELRP, hourly UCAP performance for Capacity Performance, sub-five-minute settlement for SRM and Economic DR, and the audit trail that defends settlement against PJM dispute. The fifth is Operator Console and APIs — dispatch override, dispute workflow, customer-facing reporting, and APIs for downstream BI, ERP, and CRM.
For multi-asset DSR aggregation patterns beyond PJM, our demand response aggregator business models breakdown covers the architecture in depth, and the demand response software providers practice page has the implementation-services view.
Build, Buy, or Accelerator: The PJM-Specific Software Decision
A few buyer profiles dominate the PJM-software procurement conversation. A utility running an internal demand response program at moderate scale is the textbook SaaS DRMS buyer — Honeywell SmartConnect, Itron, Tantalus, AutoGrid, and Uplight all ship competent products for that case (neutral category framing; AutoGrid and Uplight are Codibly ecosystem partners). A CSP scaling from one hundred to one thousand sites needs more flexibility than SaaS DRMS offers but rarely justifies a full custom build. A hardware OEM building a managed-charging or VPP program needs deep custom integration with proprietary asset telemetry. A multi-market aggregator running PJM, MISO, ERCOT, and CAISO simultaneously needs proprietary portfolio optimization that vendor SaaS does not expose.
The ERCOT side of that multi-market portfolio is its own software project. Texas is energy-only, has no capacity market, and runs four formal DR programs (ERS, LaaR/CLR, VLRP, ADER) plus 4CP-driven C&I behavioral DR administered by the TDSPs. Aggregator software designed for capacity-market environments translates poorly without ERCOT-specific MIS integration, sub-second telemetry for CLR, and 4CP forecasting; the ERCOT demand response software guide walks through the four-program stacking architecture in detail.
The middle path most buyers underweight is accelerator-led partnership: starting from a certified protocol stack and building the dispatch, optimization, and settlement layers around it. For aggregators evaluating pjm demand response software against custom alternatives, the accelerator path collapses the protocol-certification timeline (the single biggest driver of build risk) while preserving the codebase ownership and roadmap control that drove the build decision in the first place. For broader vendor-category disambiguation, see the demand response companies vendor selection guide.
| Buyer profile | Recommended path | What you trade | Typical timeline | PJM certification needed |
|---|---|---|---|---|
| Utility running internal DR program at moderate scale | SaaS DRMS (Honeywell SmartConnect, Itron, Tantalus, AutoGrid, Uplight) | Roadmap dependency, multi-year licensing, limited control over dispatch logic. Standard ELRP and Capacity Performance well covered. | 3–6 months | Vendor handles PJM CSP registration as service; utility retains end-customer relationship. |
| CSP scaling 100 → 1,000 sites | Accelerator-led partnership (certified protocol stack + custom dispatch and settlement) | Higher upfront engineering cost; preserves multi-protocol coverage and proprietary CBL methodology that drives margin at scale. | 6–9 months | CSP holds direct PJM CSP registration; platform supports DR Hub API integration end-to-end. |
| Hardware OEM or automaker building managed-charging or VPP program | Accelerator-led with deep OEM telemetry integration | Codebase ownership and protocol independence; OEM-specific telemetry pipelines beyond what SaaS exposes. | 6–12 months | Direct CSP registration or partnership with a CSP for market access; OEM controls asset registry. |
| Multi-market aggregator running PJM, MISO, ERCOT, CAISO simultaneously | Custom in-house platform | Highest cost; full control over portfolio optimization across markets, settlement methodology, and roadmap. Justified by margin sensitivity at scale. | 9–18 months | Direct registration in each ISO/RTO; PJM is one of four certification stacks the platform handles. |
| Single-asset large participant (hyperscale data center) | Hybrid: third-party CSP for market access + custom telemetry/control software | Procurement complexity; but the value of a single-asset bid often justifies bespoke control software the CSP cannot provide. | 4–8 months | CSP registration handled by partner; data center operates direct facility-level telemetry into CSP platform. |
What to Verify Before Signing With Any PJM-Targeted Software Vendor
Six questions every procurement team should bring to vendor evaluation, drawn from the implementation patterns that decide whether a PJM-targeted platform scales past its first program:
- Which PJM programs are bid into directly, and which through a partner CSP? Some “PJM-compatible” vendors actually proxy bids through a registered CSP, which means contract terms, settlement timing, and dispute workflow are not under the buyer’s control.
- Latency targets per program — verified against production telemetry. Sub-second for SRM, sub-minute for ELRP, hourly for Capacity Performance PAH. Ask for production data, not vendor specs.
- What is the M&V baseline approach, and is it PJM-PAH-compatible? CBL methodology, weather-normalized regression, or synthetic comparable. Whichever the vendor uses, it has to survive PJM dispute. DR protocol certification is the parallel certification concern at the signal-acquisition layer.
- Does the platform model Capacity Performance Non-Performance Charges as a forward liability? A platform that treats NPC as a settlement-time surprise leaves money on the bid-auction table.
- Multi-program portfolio optimization. Can the platform decide which sites curtail for ELRP versus Capacity Performance versus SRM at any moment, given the relative settlement value and penalty exposure? This is the one feature that separates a single-program platform from a multi-program one.
- Exit cost — and how is the historical performance data portable? A platform that locks in performance history at vendor-proprietary format makes the exit a discovery exercise. Settle data portability terms before signing, not after.
The PJM Software Question Is a Multi-Program Portfolio Question in Disguise
The PJM-targeted DR software stack a buyer picks is, in practice, a decision about how many PJM programs the buyer can bid simultaneously, and how much margin the buyer keeps after Capacity Performance Non-Performance Charges and portfolio-optimization losses. Single-program platforms ship faster and cost less, but they cap revenue at the boundary of one program. Multi-program platforms cost more upfront and demand more from the procurement team, but they preserve the optionality that matters once an aggregator scales past its first auction.
The architectural decisions that separate the two are visible in procurement. They sit in the five-subsystem model above and surface in the six selection questions. The buyers who get this right treat the PJM software platform as a strategic margin asset rather than a back-office tool. For teams scoping the next PJM build or procurement, our demand response software providers practice page and the OpenADR Accelerator provide the implementation entry points.
Frequently Asked Questions
PJM demand response is the family of mechanisms by which curtailable load and behind-the-meter resources participate in PJM’s wholesale electricity markets — capacity, energy, and ancillary services. It includes Emergency Load Response, Capacity Performance, Synchronized Reserve, and Economic Demand Response, each with different dispatch rules, telemetry requirements, and settlement methods. For broader aggregator economics, see our demand response aggregator business models breakdown.
Emergency Load Response Program (ELRP) is event-driven — PJM dispatches enrolled load during emergency conditions for two-to-four-hour windows with thirty-minute to two-hour notification, and pays for delivered curtailment. Capacity Performance is a year-round commitment paid through the capacity auction, with delivery measured against Performance Assessment Hours and Non-Performance Charges for underperformance. ELRP rewards event-by-event delivery; Capacity Performance rewards continuous availability during peak hours.
A registered Curtailment Service Provider aggregates many small and mid-sized demand-side resources into a single market-eligible bid, handles enrollment, dispatch, and PJM settlement on the participants’ behalf, and distributes revenue back. The aggregator absorbs the operational complexity of telemetry, baseline calculation, and dispute management — which is why most C&I sites participate through a CSP rather than registering directly. The full economics live in our demand response aggregator business models breakdown.
Capacity Performance pays based on the auction clearing price for the relevant Delivery Year. The 2025/2026 BRA (in effect through May 31, 2026) cleared at $269.92 per MW-day for the RTO, with the BGE and Dominion zones hitting their zonal caps at $466.35 and $444.26 respectively. The 2026/2027 BRA (starting June 1, 2026) cleared at the $329.17 system-wide cap with all zones converging at the cap, equivalent to roughly $120,000 per MW-year — a 22% RTO-wide increase. ELRP adds capacity availability payments plus per-event energy payments. SRM and Economic DR pay through their respective real-time markets.
PJM demand response aggregators run a five-subsystem software stack covering signal acquisition (PJM DR Hub API, OpenADR), asset registry and telemetry (Kafka or MQTT streaming), dispatch and optimization (multi-program portfolio engine), M&V and settlement (CBL, hourly UCAP performance, audit trail), and operator console plus APIs. Some buy SaaS DRMS for the standard mid-market case; others build custom or use accelerator-led partnerships when proprietary dispatch logic, multi-market participation, or OEM integrations require it. For the deeper architecture context, see our demand response software & platform pillar.