The Interconnection Queue Backlog: What Developers Do While They Wait

The US interconnection queue backlog got smaller in 2025. Around 8,200 projects were still actively seeking a connection at the end of the year, carrying 1,312 GW of generation and 749 GW of storage, and Lawrence Berkeley National Laboratory records total active queue volume down 10% year on year. The queue shrank because developers gave up.
Berkeley Lab’s own framing of its Queued Up: 2026 Edition data is that the backlog eased amid high withdrawals. That is a different sentence from “the backlog is clearing,” and it should change how a development pipeline is planned. A separate 549 GW already holds a draft or executed interconnection agreement and has still not reached commercial operation. Those projects are through the study process. They are still not delivering electricity, or revenue.
For anyone sequencing sites across two or three markets, that reframes the planning problem. Moving up the list is one strategy among several, and it is the slowest of them. Three routes to a connection do not depend on queue position at all, and each trades a different kind of certainty for time.
How big the interconnection queue backlog actually is
The headline number is over 2,060 GW of active capacity, which is several times the installed generating capacity of the entire country. The composition underneath it moved sharply in 2025.
| Resource in the active queue (end-2025) | Active capacity | Year-on-year change |
|---|---|---|
| Solar: utility-scale photovoltaic | 773 GW | Down 19% |
| Storage: standalone and hybrid batteries | 749 GW | Down 16% |
| Wind: onshore and offshore | 220 GW | Down 19% |
| Natural gas: thermal generation | 253 GW | Up 86% |
| Total active queue | Over 2,060 GW | Down 10% |
Solar, storage, and wind each fell between 16% and 19% in a single year while gas rose 86%. Interconnection queue data of that shape describes a competitive reallocation, and renewable developers are on the losing side of it. Gas capacity is entering at speed. Renewable sponsors write off development spend and walk away from positions they have held for years.
Why interconnection queue delays compound
Duration is what drives withdrawal. RMI’s analysis of PJM Interconnection puts the average interconnection timeline there at over eight years in 2025, against under two years in 2008. That figure comes from RMI rather than from PJM’s own filings.
Eight years is longer than most equipment supply agreements, most site control options, and the patience of most capital. A project that entered a queue in 2019 was underwritten against tax credit rules, module prices, and power purchase agreement terms that no longer exist. Withdrawal is often the rational decision, which is precisely why the backlog eased.
What Order 2023 promised and what it delivered
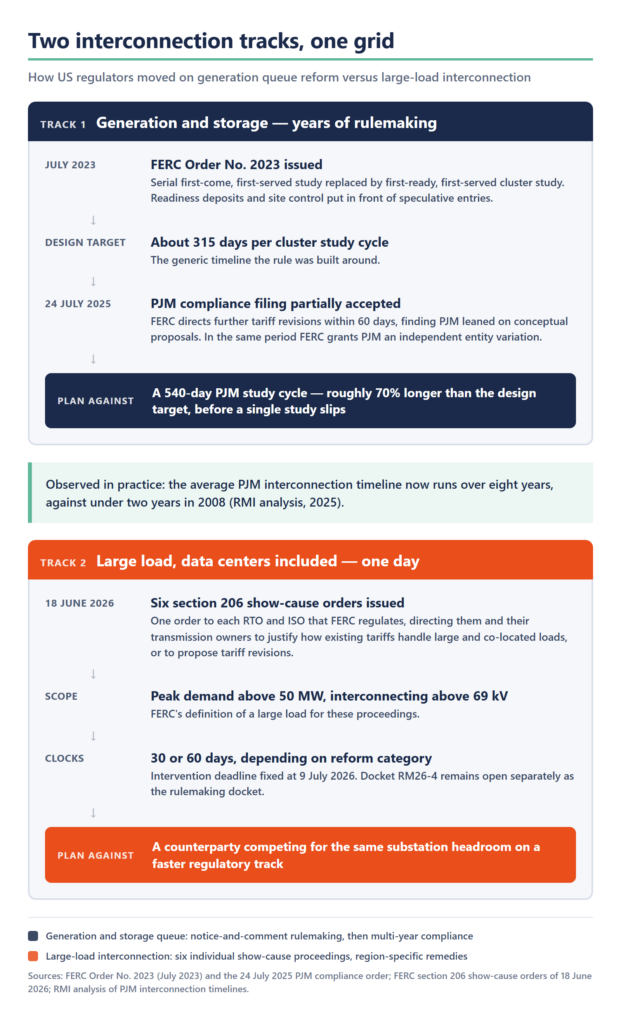
FERC Order No. 2023, issued by the Federal Energy Regulatory Commission (FERC) on 28 July 2023 in docket RM22-14, was a genuine structural fix. It replaced serial first-come, first-served study with first-ready, first-served cluster study, put readiness deposits and site control requirements in front of speculative entries, and set a design target of roughly 315 days for a cluster study cycle.
Then compliance happened. On 24 July 2025 FERC partially accepted PJM’s compliance filing for Order Nos. 2023 and 2023-A and directed further revisions within 60 days, finding that PJM had leaned on conceptual proposals rather than writing the required changes into its tariff. In the same period FERC granted PJM an independent entity variation for a 540-day study cycle. The loop did not close there. PJM filed again on 20 January 2026, and on 16 April 2026 FERC accepted that filing in part and rejected it in part, in docket ER24-2045-004, directing yet another compliance filing by 18 May 2026. Nearly three years after the final rule, the tariff language was still being negotiated.
That is the number a developer should plan against in the largest US electricity market: roughly 70% longer than the generic design target, approved by the regulator, before a single study slips. Interconnection queue reform is real, and it is working broadly as designed. The design was never fast enough to rescue a project that has to reach commercial operation this decade.
The data-center track is moving faster than yours
On 18 June 2026 FERC issued six separate show-cause orders under section 206 of the Federal Power Act, filed alongside its open large-load rulemaking in docket RM26-4, one to each regional transmission organization (RTO) and independent system operator (ISO) it regulates, directing them and their transmission owners to justify how existing tariffs handle interconnection of large and co-located loads, or to propose tariff revisions. FERC defined large load as peak demand above 50 MW interconnecting at above 69 kV, set clocks of 30 or 60 days depending on the reform category, and fixed 9 July 2026 as the intervention deadline. Docket RM26-4 remains open separately as the rulemaking docket.
The procedural choice is the signal. FERC picked six individual show-cause proceedings over a notice-and-comment rulemaking, on the reasoning that it moves faster and allows region-specific remedies. Generation queue reform took years of rulemaking. Large-load interconnection got six orders in one day.
For site selection the implication is blunt. Any feeder or substation attractive to a hyperscaler is a place where available headroom is being competed for by a counterparty with a faster regulatory track, deeper pockets, and no tolerance for curtailment. Sequence around that, or expect to lose the position.
Three routes that do not wait for the queue
None of these three is free.
| Route | What you are actually buying | What you give up | Where it fits |
|---|---|---|---|
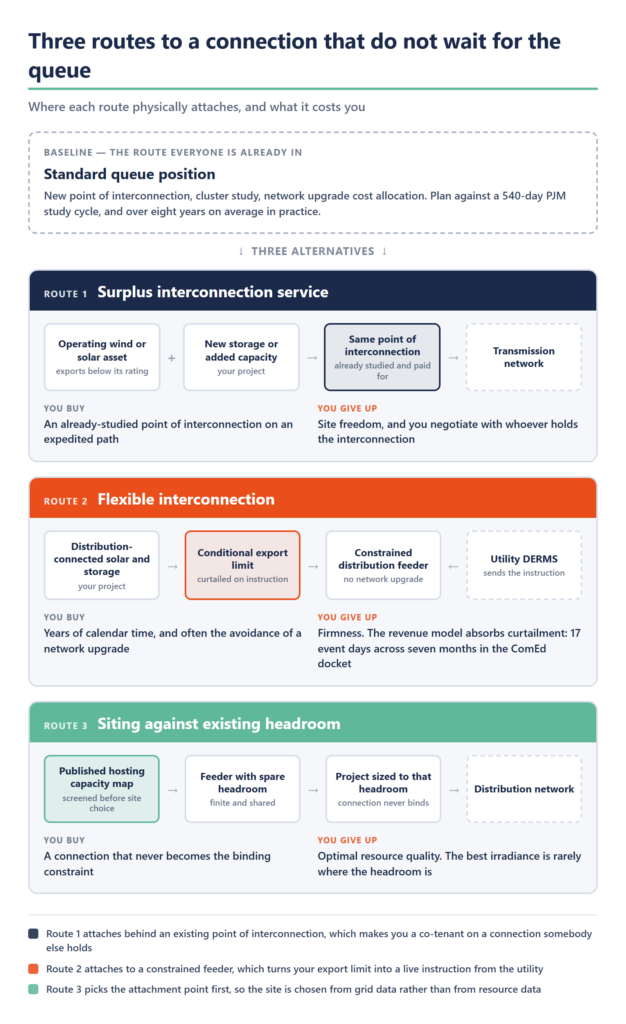
| Surplus interconnection service: using the unused portion of an existing generator’s interconnection service at the same point of interconnection | An already-studied point of interconnection on an expedited path | Site freedom. You go where the existing interconnection is, and you negotiate with whoever holds it | Storage added at an operating wind or solar site, repowering, co-location on a partner’s asset |
| Flexible interconnection: a conditional connection that accepts export curtailment when the network is constrained | Years of calendar time, and often the avoidance of a network upgrade | Firmness. Export is limited at the operator’s instruction, which the revenue model has to absorb | Distribution-connected solar and storage in the states that run a program |
| Siting against existing headroom: choosing the site from published hosting capacity data before choosing the project | A connection that never becomes the binding constraint | Optimal resource quality. The best irradiance is rarely where the headroom is | Portfolio development where site selection is still genuinely open |
Surplus interconnection service was created by FERC Order No. 845 in 2018, and it is the least used and the least complicated of the three. Where a point of interconnection is rated well above what the operating asset behind it actually exports, that difference is a connection somebody has already paid for and studied.
Flexible interconnection is the route with regulatory momentum behind it. At least six states have programs live or in formation: California, which was first to allow distributed solar and storage to connect on limited-export terms; Colorado, where the Public Utilities Commission ordered Xcel to file a flexible interconnection tariff covering both generation and EV charging load; Illinois; New York, where Avangrid and National Grid have both piloted; Massachusetts; and Minnesota. Illinois is the most instructive of them, and we have written separately on what compliance with ComEd’s interconnection rules requires of a distributed energy resource (DER).
ComEd’s grid plan proposes a $21.2 million DER management system (DERMS) expansion to enable a minimum of 240 MW of DER capacity. Demonstrations to date have enabled 6.75 MW. That distance between a 240 MW target and 6.75 MW delivered, documented in Illinois Commerce Commission docket P2022-0486, is the state of flexible interconnection in 2026: policy is running well ahead of deployment. The same docket puts a number on curtailment exposure, at least for one program. DERMS-connected customers saw 17 curtailment event days across seven months in 2022. What a conditional connection actually requires on both sides of the meter is the subject of our whitepaper on flexible interconnection and conditional grid access.
The third route depends on data that utilities have historically published badly. That is changing under regulatory pressure. The Colorado Public Utilities Commission order of 29 October 2025, in proceeding 24A-0547E, also requires Xcel to remove restrictions on its hosting capacity maps and refresh them, moving to monthly updates by the end of 2026 and hour-by-hour analysis by the end of 2027. Grid capacity data is becoming a public obligation, and the developers who build that data into site screening will pick better sites than the ones screening on irradiance and land cost alone.
What this changes about how you pick a site
Queue position and available headroom now rank above resource quality in a site screen. A site with slightly lower yield and a connection route that closes three years earlier wins on net present value once current study timelines are priced into the model, and it wins again on the tax equity calendar.
That reordering has a second consequence. Every one of the three routes converts an interconnection problem into an operating problem. Surplus interconnection service makes you a co-tenant on someone else’s point of interconnection. Flexible interconnection makes your export limit a live instruction from the utility. Siting against headroom means the headroom is finite and shared, and it will shrink as neighbors connect. Each of those has to be answered by the asset itself, which is why the control layer stops being an implementation detail the moment a connection becomes conditional. Codibly built a custom DERMS platform for APG&E spanning ERCOT, PJM, and NYISO for that reason: multi-market participation holds together only when enrollment, dispatch, and telemetry are one system.
Two adjacent questions usually follow. Where a site cannot grow its connection at all, the answer moves behind the meter. Where the answer is aggregation across many constrained sites, the architecture decisions are set out in our guides to DERMS software platforms and virtual power plant software.
Sequencing is the only lever you fully control
Nothing a developer does changes a 540-day study cycle or a 549 GW pile of signed agreements waiting to energize. Sequencing is controllable. So is the decision to screen a portfolio against published hosting capacity, to look for underused points of interconnection before greenfield ones, and to underwrite a conditional connection properly instead of treating curtailment as an unpriced risk.
Codibly works with developers, aggregators, and utilities on the systems that make those routes operable, from custom renewable energy software through regulatory compliance and protocol implementation for the interconnection standards each market enforces. The projects that reach commercial operation first over the next five years will be the ones that stopped treating the queue as the only route in.

Frequently Asked Questions
An interconnection queue is the ordered list of proposed generation and storage projects waiting for a transmission provider to study what connecting them would do to the grid, and what network upgrades the project would have to pay for. Every regional transmission organization and independent system operator runs one, as do many individual utilities. Under FERC Order No. 2023, projects are studied in clusters rather than one at a time, and position depends on readiness criteria such as site control and deposits rather than arrival date alone.
Yes, though not as a single grid. The contiguous United States operates as three largely independent synchronous interconnections: the Eastern Interconnection, the Western Interconnection, and ERCOT, which covers most of Texas. They are joined only by a small number of direct current ties. Alaska and Hawaii operate separately again. For a developer, the practical consequence is that queue rules, study timelines, curtailment practice, and flexible interconnection availability all vary by region. There is no national queue and no national wait.