How to Model Renewable Energy Curtailment Before You Finance It

California’s grid operator turned away 3.4 million megawatt-hours of wind and solar in 2024. Renewable energy curtailment is that deliberate reduction of output the grid cannot absorb. It rose 29% in one year, and solar accounted for 93% of it, according to the US Energy Information Administration (EIA) and its Today in Energy analysis published on 28 May 2025.
Most project models still treat that as a haircut. One percentage, applied flat across annual production, chosen by feel and defended by optimism. It survives internal review because nobody on either side of the table has a better number. It stops surviving the moment a lender asks where the number came from, and it stops being adequate entirely once the connection agreement itself says the grid operator may curtail you.
Curtailment has now become large enough, frequent enough, and machine-recorded enough to be modeled properly. The same software layer that executes a curtailment instruction is the layer that logs it. That changes what a developer can prove.
Renewable energy curtailment is now a design input
On a conditional or flexible connection, curtailment is something you agreed to. The trade is explicit: energize years earlier, accept reduced export when the feeder or the interface is tight. The alternative is a firm connection at the back of a queue that clears on nobody’s business plan.
Two mechanisms produce the same line in your model. Economic curtailment happens when there is more generation than the market wants and prices fall through zero. Congestion or reliability curtailment happens when the network physically cannot carry the flow, which is the system-side reason a grid operator reaches for the curtailment lever in the first place. The first is a price event, the second is a physics event, and both arrive as lost megawatt-hours.
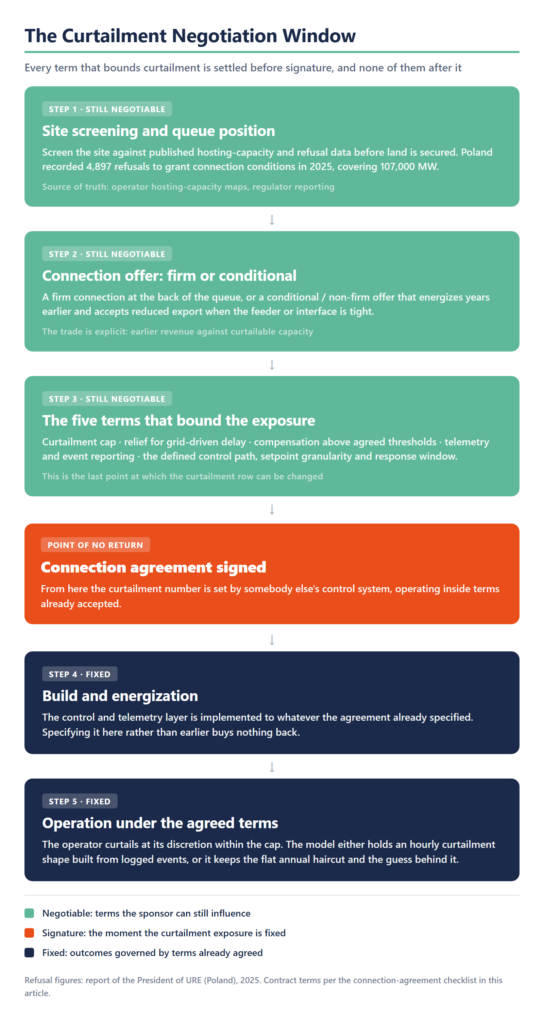
The window for influencing either one closes at signature. After that, the curtailment number is set by somebody else’s control system operating inside terms you already accepted. Everything worth negotiating is upstream of that.
What the US numbers already cost you
CAISO, the California Independent System Operator, is the clearest case because California’s wind and solar capacity grew from 9.7 GW in 2014 to 28.2 GW at the end of 2024 (EIA). Curtailment tracked that build-out and then accelerated past it.
The 2026 picture is sharper. Spring solar curtailment reached a record 4.8 GW, CAISO solar captured an average price of negative $1.7 per MWh, and in June 2026 negative day-ahead price hours tripled year on year to 66, according to analysis published by Modo Energy on 23 July 2026. The number that should move a commercial team is the spread: a day-ahead trough averaging $7 per MWh at 2pm against a 7pm peak of $35 per MWh.
That spread is a price signal. The market is paying five times more for the same electron four hours later, which is the economic case for shifting rather than spilling, and it is the same signal that drives merchant battery revenue in ERCOT.
Curtailment of renewable energy is now predictable enough to forecast
Curtailment is unevenly distributed across the year, which is precisely why it can be forecast. It clusters in mild-weather shoulder seasons, in midday hours, on specific constrained feeders and interfaces. It has a shape.
Distribution-level programs give the same picture at project scale. ComEd’s own reporting to the Illinois Commerce Commission (docket P2022-0486, workshop report of 22 April 2025) records customers connected to its distributed energy resource management system (DERMS) seeing 17 curtailment event days across seven months in 2022. Seventeen days is a number a model can hold. “Occasional curtailment” gives it nothing to hold.
The European version has a different name and a different bill
European operators reach the same outcome through different legal instruments, and the commercial consequences differ enough that a US-built model will misprice a European asset.
In the Netherlands the queue is the constraint. Regional grid operators hold 8,539 injection requests representing 4,591 MW, and TenneT holds 161 injection requests for 34 GW (Netbeheer Nederland). The response has been contractual: capacity restriction contracts since 2022 and non-firm transport agreements since 2024, which trade guaranteed capacity for earlier access or a tariff advantage.
Germany has drawn a harder line. In a decision of 30 March 2026 (Az. BK6-25-325), the Bundesnetzagentur resolved an abuse proceeding brought by BESS Germany 1 GmbH against E.DIS Netz GmbH and upheld the operator’s refusal to connect a battery storage facility, holding that large batteries fall outside KraftNAV and are assessed under §17 Abs. 2 of the Energy Industry Act. A German distribution system operator can lawfully say no, and the regulator has now confirmed it in a contested case.
Poland refuses at volume: 4,897 refusals to grant connection conditions in 2025, covering 107,000 MW of requested capacity, per the report of the President of URE, the Polish energy regulator.
| Market and mechanism | Who initiates it, and why | What it costs the asset owner | What the model needs |
|---|---|---|---|
| US wholesale (CAISO) | Economic dispatch: oversupply drives prices to or below zero | Lost volume plus negative capture prices in the affected hours | Hourly price shape and negative-hour counts, not an annual average |
| US distribution (flexible interconnection) | Local congestion: the utility limits export when the feeder is tight | Lost volume, generally uncompensated, bounded only by the agreement | The contractual cap, event frequency, and utility hosting-capacity data |
| Netherlands (non-firm transport) | Contracted flexibility: capacity is released back to the operator on defined terms | Reduced firm capacity, traded for earlier access or a tariff advantage | The restriction windows and the value of the access or tariff trade |
| Germany (redispatch and refusal) | Congestion management under the Energy Industry Act; connection may be refused outright | Curtailment is generally compensated under national rules; refusal costs the project entirely | Compensation terms, plus connection-refusal risk priced before land is secured |
| Poland (connection refusal) | Capacity shortage: 4,897 refusals covering 107,000 MW in 2025 (URE) | No connection at all, so no revenue line to curtail | Site screening against published capacity, and cable-pooling alternatives |
Grid congestion management, redispatch, and non-firm connection terms describe one bargain in three legal dialects, which is also the pattern running through the six pillars of consumer flexibility in the EU and US. What changes between them is who pays for the curtailed hour.
Australia already did this, and the software already exists
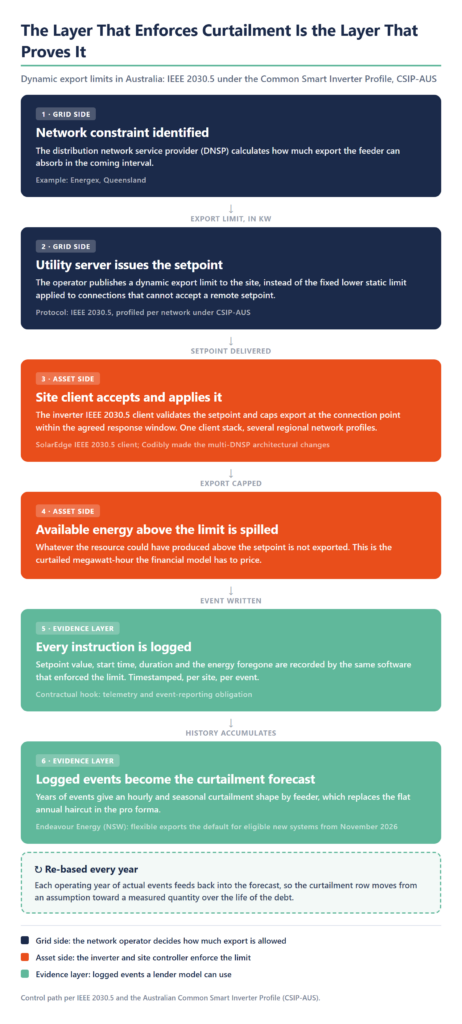
Australia has been running conditional export at national scale for years. Distribution network service providers (DNSPs), Energex in Queensland among them, apply a solar export limit to new rooftop connections and offer a higher, dynamically managed limit to systems that can accept a remote setpoint. The direction of travel is set: Endeavour Energy in New South Wales makes flexible exports the default connection option for eligible new and upgraded solar systems from November 2026, and in Western Australia, rules in force since 1 May 2026 give new systems a choice between a remotely managed export product and a standard 1.5 kW export limit. The control path in both is IEEE 2030.5 under the Australian Common Smart Inverter Profile, CSIP-AUS.
Codibly worked with SolarEdge on exactly this problem. SolarEdge needed its IEEE 2030.5 client to satisfy several Australian networks at once, each with its own localized requirements, without disturbing an already certified stack. Codibly made the architectural modifications that connected it to those regional networks (SolarEdge multi-DNSP integration).
An export limit enforced by software is an export limit recorded by software. Every setpoint, every event, every duration, timestamped. A market that has been running dynamic limits for years has an evidence base that a market issuing its first flexible connection agreement does not. That evidence base is what a curtailment forecast is built on, and building it is the job of the optimization and aggregation layer sitting between the asset and the network operator.
Modeling curtailment so a lender will accept it
The strongest objection to conditional connections is a financing objection. Lenders price certainty. A connection that can be curtailed at an operator’s discretion weakens the revenue stack, limits participation in wholesale and balancing markets, and introduces a risk with no settled allocation convention between sponsor, lender, and offtaker. The remedy that follows is not complicated, and it is the one lenders and sponsors have converged on: price and allocate curtailment risk explicitly, at the front of the deal, rather than discovering it in year two.
That is achievable. A conditional connection earning revenue in year two beats a firm connection earning revenue in year eight, and the gap is wide enough to absorb a well-characterized curtailment exposure. The condition is that the exposure has to be characterized rather than assumed away.
What the model has to contain
Three contractual terms and two data obligations carry most of the weight.
| Term to fix before signature | What it fixes | What the lender’s model does with it |
|---|---|---|
| Curtailment cap | A stated ceiling on curtailed energy or event hours per year | Sets the downside case, so the debt sizing has a floor |
| Relief for grid-driven delay | Schedule and cost relief when the operator’s works slip | Removes a timing risk the sponsor cannot control from the base case |
| Compensation for grid outages | Payment terms when curtailment exceeds agreed thresholds | Converts tail risk into a receivable rather than an unpriced loss |
| Telemetry and event reporting | Operator obligation to log and share every curtailment instruction | Supplies the actuals that re-base the forecast each year |
| Defined control path | The protocol, setpoint granularity, and response window that enforce the limit | Confirms the cap is technically enforceable, and auditable after the fact |
An hourly curtailment shape derived from operator data beats a flat annual haircut in every direction that matters. It prices the storage case correctly, it shows the offtaker which hours are genuinely at risk, and it converts a discretionary-sounding clause into a bounded quantity. Getting that shape into dispatch decisions is a load balancing and energy optimization problem before it is a financing one.
Why low pilot curtailment is encouraging and still not an underwriting basis
The pilot evidence looks excellent. In New York, Avangrid’s flexible interconnection pilot connected three 5 MW solar sites, 15 MW in total. Over more than three years, actual curtailment came to 0.047%, against a forecast of 0.27%, according to the utility’s reports to the New York Department of Public Service.
Treat those figures as encouraging and unusable for underwriting. They come from small samples on early programs, on feeders that were not yet crowded, and the whole purpose of a flexible interconnection program is to put more capacity behind the same constraint. Curtailment on a given feeder is a function of what else connects there over the next decade, and none of the pilot numbers capture that. Underwrite the contractual cap. Model the pilot data as the upside case, and label it as such.
Fix the number while it is still negotiable
Curtailment risk becomes financeable at the point where it stops being a discretionary act by a third party and becomes a bounded, instrumented, contractually capped quantity. That transition happens in software, in the control and telemetry layer that both enforces the limit and proves what it did. Specify that layer before signing, and the curtailment row in the model has numbers in it. Leave it to the implementation phase, and the model keeps the guess.
The projects that clear credit committee over the next few years will be the ones that walk in already knowing their worst hour, their worst week, and the ceiling written into their own connection agreement.
Frequently Asked Questions
Curtailment in renewable energy is the deliberate reduction of output from a wind or solar plant below what the resource could physically produce at that moment. It is instructed by the grid operator, or triggered automatically by a control system acting on the operator’s behalf, and it happens for two broad reasons. Either there is more generation than the market can absorb, so prices fall to or below zero, or the network physically cannot carry the flow at that point. In CAISO, 3.4 million megawatt-hours were curtailed in 2024, 93% of it solar (EIA). On a flexible or non-firm connection, curtailment is a term the project agreed to in exchange for connecting earlier, which is why it belongs in the financial model rather than in a risk register.
Energy curtailment is the broader term for reducing the output or consumption of an energy resource below its available capability, for reasons of market economics, network capacity, or system security. Applied to generation it means spilling available wind or solar; applied to load or storage it can mean limiting import at a constrained connection point. The mechanism carries different legal names in different markets: economic dispatch and flexible interconnection in the United States, redispatch and congestion management in Germany, non-firm transport agreements in the Netherlands, and dynamic export limits in Australia. The commercial substance is the same in each case. Someone else decides how much of your available energy reaches the grid, within limits that should have been negotiated before the connection agreement was signed.